![]() Graphic Orientation
Graphic Orientation
Graphic History uses image mnemonics to make chrnonological information easier to remember. There are Ten Scales of chronologies from 109 to 100 years or one billion years to one year. Five of the scales from 109 to 105 are used for Natural History, and five from 104 to 100 years for Human History. The numbers in dates are somewhat arbitrary, in that the 1st year from which they are sequenced rarely has any meaningful relationship with a previous or later date. Graphic Chronologies are like time maps that chunk years into groups the way calendars group days into weeks and months. Imagine using a simple one dimensional number line to keep track of the 365 days in a year instead of a calendar.
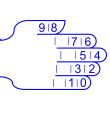
| Most yearly calendars are tables having seven columns for each day of the week and are separated into 12 monthly grids. Type 1 and Type 2 Graphic Chronologies, are comprised of two columns and five rows. Type 3 chronologies for single years have three columns and four rows. |  |
| The flow of time from cell to cell is the same as a common calendar, but there are two patterns for numbering the cells. Type 1 is for historical periods in which the number of the year decreases as you move forward in time. This includes historical periods Before Christ, B.C., or Before the Common Era, B.C.E., and all Natural History chronologies Before the Present, B.P.. Type two is used for all historical periods of the Common Era, which began with the year 1 A.D. | |
 |

|
|
 |
Natural history chronologies are 1,000,000,0000, 100,000,000, 10,000,000, 1,000,000, or 100,000 years long. Each of the human history chronologies reperesents time periods of either 10,000, 1,000, 100, or 10 years or 1 year. Note the year 0 in the bottom right and top left cells of the graphic
decades. There was no year 0, but in the folowing decades this cell is used for the years
10, 20, 30, 100, etc. The
shading between chronologies indicates that chronolgies can be included as cells in
chronologies that are ten times longer, and that each cell within a chronology can be
subdivided into its own ten cell table.
Clicking on the grid |
 |
 |
You can memorize these chronologies using Image Mnemonics. Associate years, decades, centuries and milleniums with the segments of your fingers. Use your left hand for Type 1 chronologies and your right for Type 2. It is easier to associate images with segments than words, so start with them. Links to articles and videos in the chronologies enable you explore topics which interest you. The key to remembering a chronology is to be able to recount at least one event in each of its 10 segments. Cooperative classroom presentations are a great way fix major events in students' minds. | 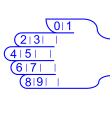
|
 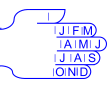 |
Type 3 grids correspond to the 12 months of a year. The left hand is used because the decades these chronologies complement are all recent decades that use a Type 2 right hand grid. This grid is also useful for recalling and planning events in the previous and current year because six of the months with 31 days form a symmetrical X in the grid. The month of July with its 31 days is not part of the X, but it easily associated with this pattern. This grid is also useful for recalling and planning events in the previous and current year because six of the months with 31 days form a symmetrical X in the grid. The month of July with its 31 days is not part of the X, but it easily associated with this pattern. |
|
 |
GRAPHIC HISTORY |
| Mnemonic Chronologies | |
© Copyright 2024 Ted O'Brien
 above each chronology will display the chronology that contains it and is ten times longer.